Our son Otávio was born recently. Right in the first few days, we decided to keep tight control on the feeding times for a while, as it is an intense routine pretty unlike anything else, and obviously critical for the health of the baby. I imagined that it wouldn’t be hard to find an Android app that would do that in a reasonable way, and indeed there are quite a few. We went with Baby Care, as it has a polished interface and more features than we’ll ever use. The app also includes some basic statistics, but not enough for our needs. Luckily, though, it is able to export the data as a CSV file, and post-processing that file with the R language is easy, and allows extracting some fun facts about what the routine of a healthy baby can look like in the first month, as shown below.

The first thing to do is to import the raw data from the CSV file. It is a one-liner in R:
> info = read.csv("baby-care.csv", header=TRUE)
Then, this file actually comes with other events that won’t be processed now, so we’ll slice it and grab only the rows and columns of interest:
> feeding <- info[info$Event.type == "Breast",
        c("Event.subType", "Start.Time", "End.Time", "Duration")]
This is how it looks like:
> feeding[100:103,]
    Event.subType       Start.Time         End.Time Duration
129          Left 2013/01/04 13:45 2013/01/04 14:01    00:16
132          Left 2013/01/04 16:21 2013/01/04 16:30    00:09
134         Right 2013/01/04 17:46 2013/01/04 17:54    00:08
Now things get more interesting. Let’s extract that duration column into a more useful vector, and do some basic analysis:
> duration <- as.difftime(as.vector(feeding$Duration), "%H:%M")

> length(duration)
[1] 365

> total = sum(duration)
> units(total) = "hours"
> total
Time difference of 63.71667 hours

> mean(duration)
Time difference of 10.47397 mins
> sd(duration)
[1] 5.937172
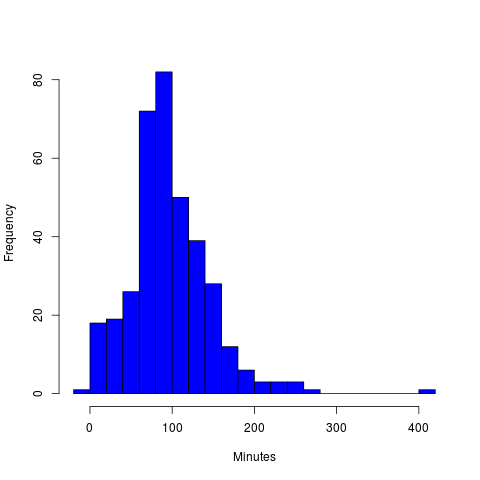
A total of 63 hours surprised me, but the mean time of around 10 minutes per feeding is within the recommendation, and the standard deviation looks reasonable. It may be more conveniently pictured as a histogram:
> hist(as.numeric(duration), breaks="FD",
    col="blue", main="", xlab="Minutes")

Another point we were interested on is if both sides are properly balanced:
> sides <- c("  Right", "  Left")
> tapply(duration, feeding$Event.subType, mean)[sides]
   Right     Left
10.72283 10.22099
Looks good.
All of the analysis so far goes over the whole period, but how has the daily intake changed over time? We’ll need an additional vector to compute this and visualize in a chart:
> day <- format(strptime(feeding$Start.Time, "%Y/%m/%d %H:%M"),
                "%Y/%m/%d")
> perday <- tapply(duration, day, sum)
> mean(perday)
[1] 136.5357
> sd(perday)
[1] 53.72735
> sd(perday[8:length(perday)])
[1] 17.49735

> plot(perday, type="h", col="blue", xlab="Day", ylab="Minutes")
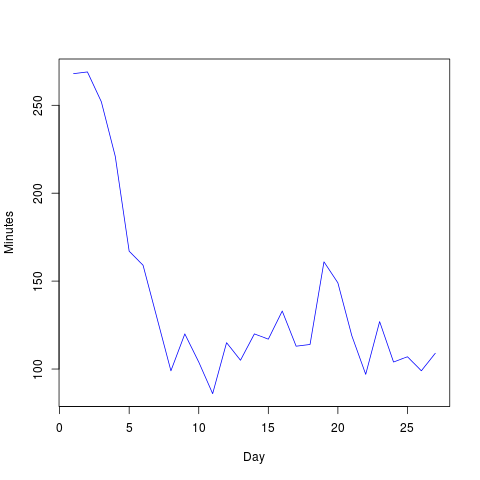
The mean looks good, with about two hours every day. The standard deviation looks high on a first look, but it’s actually not that bad if we take off the first few days. Looking at the graph shows why: the slope on the left-hand side, which is expected as there’s less milk and the baby has more trouble right after birth.
The chart shows a red flag, though: one day seems well below the mean. This is something to be careful about, as babies can get into a loop where they sleep too much and miss being hungry, the lack of feeding causes hypoglycemia, which causes more sleep, and it doesn’t end up well. A rule of thumb is to wake the baby up every two hours in the first few days, and at most every four hours once he stabilizes for the following weeks.
So, this was another point of interest: what are the intervals between feedings?
> start = strptime(feeding$Start.Time, "%Y/%m/%d %H:%M")
> end = strptime(feeding$End.Time, "%Y/%m/%d %H:%M")
> interval <- start[-1]-end[-length(end)]

> hist(as.numeric(interval), breaks="FD", col="blue",
       main="", xlab="Minutes")
Seems great, with most feedings well under two hours. There's a worrying outlier, though, of more than 6 hours. Unsurprisingly, it happened over night:
> feeding$End.Time[interval > 300]
[1] 2013/01/07 00:52
It wasn't a significant issue, but we don't want that happening often while his body isn't yet ready to hold enough energy for a full night of sleep. That's the kind of reason we've been monitoring him, and is important because our bodies are eager to get full nights of sleep, which opens the door for unintended slack. As a reward for that kind of control, we've got the chance to enjoy not only his health, but also an admirable mood.
Love, Dad.
Hey Gustavo! Nice article!
I have two kids e never know in details how important was that kind careness. :-)
If I decide to have a new baby, I for sure will pay more attention and participate so much on that process.
Congratulations, for the baby and for the article!